- Home page
- Demonstration
- User Guide
- Subscription Guide
- Data Extractioin Criterias
- Accounting Periods Calendar
- Frequently Asked Questions
| Online Reports |
Details by Product
This report presents a product-by-product, period-by-period breakdown of the sales posted for the current year as well as the two previous years. Figures on the three most
recent periods may be broken down by week. The report also features an updated inventory (warehouse and retail stocks) and an order history. Page breaks indicate a change
in product.
|
Sales Summary
This report presents the sales for each sample product for the selected period, as well as the 13 preceding periods. Figures on the three most recent periods may be broken
down by week. Each product appears on a separate line, with a grand total for all the products at the end.
|
Sales by Product - 50 Best Outlets
This report presents a breakdown of sales per product, in order of the outlets' respective sales volume for a given period. The 50 top-selling outlets are displayed.
Each outlet appears on a separate line. Page breaks indicate a change in product.
|
Sales by Outlet
This function will provide a PDF file containing the cumulative sales of each product for a specific outlet. This extraction contains the following data: category,
article and its description, size, sales prices, dollar sales, sales bottles, product status, and product group.
|
| Additional reports |
Sales Summary all products (CSV file)
This function provides files containing the total sales for each product on INFOCOM for each week available of the last three periods. The files are presented as compressed
CSV files. Their format is similar to the files provided by the "Download raw data" subscription.
The "Sales Summary all products" files contain the following information: SAQ product code (IPC), UPC, Product Description, Sales unit, Quantity of bottles sold, Year, Period,
Week. If additional information is required, it may be necessary to also subscribe to the "Download raw data" function for one or more products. For example to have access to
the file listing the complete characteristics of all products.
|
Evolution of Sales by Category
This report analyzes the sales for all the products managed by the SAQ, presented in order of total sales per product category. For each product, the variation between the sales
during the current and previous period, as well as between the current period and corresponding period from the previous year, is expressed as a percent. Each product appears on
a separate line. A total for all the products in each category is also included. Page breaks indicate a change in category. The report also features a cover page with a summary
of the various categories.
|
Sales trends by Category
This report gives, for all the categories defined by the SAQ, a comparison by category of products between the total sales of the current year and those of the previous year in
order to evaluate your market potential. For each category, the file contains sales of the current period for this year and the previous one. It also contains the total sales for
the current and the previous year. You will also obtain the sales variation in % between the two years. Each line represents a category and at the far end of each, you will find
the % of sales that your category represents on all SAQ sales.
|
| Raw Data |
This subscription option gives you access to all the unfiltered data required to create your own reports. It is intended for organizations
with the technological resources necessary to process the data. All information remains the exclusive property of the SAQ and is subject to the Terms of Usage of the
registration agreement.
Further information on formatting the data can be obtained by following this link :
Raw Data formatting.
|
Sales by category
This subscription option allows you to select a category defined by the SAQ in which your products are represented. This file was created in order to simplify de selection of
products during the subscription. As this option will only give you the sales, the category of products will appear in the Weekly sales file download.
Please note It is impossible to select this option when you have suscribed to all the products since you already have all the necessary information in your actual subscription.
|
SAQ Inspire - Product Performance
This file presents weekly datas by outlet for each product belonging to the subscriber, sales related to SAQ Inspire. The extraction will provide sales bottles and dollars as well
as the number of transactions Inspire SAQ. The three (3) most recent periods will be available for download.
|
Online Reports
Reports available as Web pages or printed files...Adobe Reader files (.PDF)
|
Basic reports :
A group of three reports with a subscription price, based on the number of products selected
Product Details :
Show the sales of the current year and the 2 previous years
Sales Summary :
The last thirdteen period total sales of all SAQ products
Sales by Product - 50 Best Outlets
|
Additionnals reports
|
Evolution of Sales by Category
: An additional report with a price based on the number of product categories selected
|
Sales summary all products
: Extraction of file based on a unique price
|
Raw Data
Data presented as .CSV compressed files and grouped as downladable .ZiP files downloadable, billed on the number of selectionned products.
|
| To subscribe, simply click on this logo: |

|
Online Reports
Details by Product - Sales Summary - Evolution of Sales by Category - Sales by Product - 50 Best Outlets
|
Parameters
When you click on one of these to launch a report, the
Parameters » page will show so you can go right to the bottom of this page and click on the « Generate » button in order to start generating a
report including all parameters.
By default, this page will allow you to generate a report online (html page format) for all of the products that you have subscribed to. You can also selec the parameters. For example,
if you want to generate a « Details by Product » report in PDF format, sort by name of product, for a specific list of products etc., select:
Output Type: Report (PDF format)
Sort Products by: Product name
Product: A Product List (list that you have created)
« Acrobat Reader », is required to output this type of files. If it is not aleredy install on your PC, you can dowload a free version at this address.
Using PDF format makes it possible to print all of the pages associated with a single request at the same time and you can save these files on your hard drive for future review.
Note: When generating PDF format reports, there is a limit to the maximum number of pages permitted for a single request. If applicable, a message will notify you
that the page limit has been reached, and you will be asked to select a set of parameters that will reduce the quantity of information to be extracted for a single report.
The available parameters vary from one report to an other. The various lists of products or outlets that you create using the « Parameters », page can be shared between
usersof your company.
Product Selection:
the parameters that are displayed under this heading can be used to specify the kind of information that the report will contain.
All Products : All products that are active in your products list, that you had subscribed for
A Specific Product : Click on the link "Select a Product" et enter the le # of the SAQ product SAQ in the appropriate section
A Product List : A sub-group of your product list
Products of a Supplier : Click on the link "Select a supplier"
Product Category : Select a category in the listbox.
Note : Don't select categories between «- -», these are not active categories.
Optional Filter on Sales and Inventories :
The parameters that are displayed under this heading do not affect the products that are included in the report, they only affect the sales and inventory numbers that are reported
for each selected product.
All Outlets
A Specific Outlet
An Outlet List
Client Type (Agency, Alimentation, Particulars...)
|
Download of Raw Data
Files that can be downloaded are compressed « ZIP » files that contain one or more csv files. When you click on the « Download » option, a
window will open in your browser that
will allow you to open or save the compressed file. Select the option that allows you to « Save » the file to your PC. Once the file has been downloaded, open the saved « ZIP »
file and extract the «csv» files.
« Csv » files are often used to transfer data between different software applications. The « csv » files for Infocom were created mainly for use as input into database systems.
However, these files can be opened using software applications such as Excel or Access.
«csv» files are often used to transfer data from a software to another. They can be used in your own personalised software or home made data base to extract personalised reports.
The file will open in Excel by double-clicking on it. A message can ask you if the file is delimiterd or not. If it's the case you can use the « Text to column » function included in Excel menus.
For any further questions or informations, please contact us at infoagent@saq-b2b.com
|
This guide is designed to provide basic support to new subscribers of SAQ’s Marketing Information, where you can purchase reports of sales, inventories, pending orders or
other activities related to SAQ business.
To start, please connect on www.saq-b2b.om
| Then click on this logo: |
|
To subscribe, select the link corresponding to your situation
Already a member?
Go to www.saq-b2b.com website and enter your user name and password. You can then subscribe to the marketing information
service.
Not a member?
To become a member, follow this link : subscribe to SAQ commercial informations
For more information, please send a request to infoagent@saq-b2b.com
Terms and Conditions :
Upon your first access to the subscription function, the “Terms and Conditions” page will be automatically displayed. At first the “Terms and Conditions” are simply
displayed for your information, but you will be requested to accept them in a later step before submitting your subscription.
Subscription Form
The following page presents a form that lets you select from a list of available services. Here is an example…
Online Reports :
(All basic Reports - Sales, Inventories Orders) : Including these reports…
Details by product:
This report presents a product-by-product, period-by-period breakdown of the sales posted for the current year as well as the two previous years. Figures on the three most recent
periods may be broken down by week with a single click on them. The report also features an updated inventory (warehouse and retail stocks) and an order history. Page breaks indicate
a change in product. See an example…
Sales Summary:
This report presents the sales for each sample product for the selected period, as well as the 13 preceding periods. Figures on the three most recent periods may be broken down by
week. Each product appears on a separate line, with a grand total for all the products at the end.
See an example…
Sales by Product - 50 Best Outlets:
This report presents a breakdown of sales per product, in order of the outlets' respective sales volume for a given period. The 50 top-selling outlets are displayed. Each outlet
appears on a separate line. Page breaks indicate a change in product.
See an example…
Additional Reports:
Sales Summary all products (CSV file):
This function provides files containing the total sales for each product on INFOCOM for each week available of the last three periods. The files are presented as compressed
.CSV files. Their format is similar to the files provided by the "Download raw data" subscription.
The "Sales Summary all products" files contain the following information: SAQ product code (IPC), UPC, Product Description, Sales unit, Quantity of bottles sold,
Year, Period, Week..
If additional information is required, it may be necessary to also subscribe to the "Download raw data" function for one or more products.
Evolution of Sales by Category:
This report analyzes the sales for all the products managed by the SAQ, presented in order of total sales per product category. For each product, the variation between the
sales during the current and previous period, as well as between the current period and corresponding period from the previous year, is expressed as a percent. Each product
appears on a separate line. A total for all the products in each category is also included. Page breaks indicate a change in category. The report also features a cover page
with a summary of the various categories.
See an example…
Sales trends by Category:
This report gives, for all the categories defined by the SAQ, a comparison by category of products between the total sales of the current year and those of the previous year
in order to evaluate your market potential. For each category, the file contains sales of the current period for this year and the previous one. It also contains the total sales
for the current and the previous year. You will also obtain the sales variation in % between the two years. Each line represents a category and at the far end of each, you will
find the % of sales that your category represents on all SAQ sales
Raw Data
Download of Raw Dat
This subscription option gives you access to all the unfiltered data required to create your own reports. It is intended for organizations with the technological resources necessary
to process the data. All information remains the exclusive property of the SAQ and is subject to the Terms of Usage of the registration agreement. Further information on formatting
the data can be obtained by sending an e-mail to infoagent@saq-b2b.com. Please clearly state the purpose of your request.
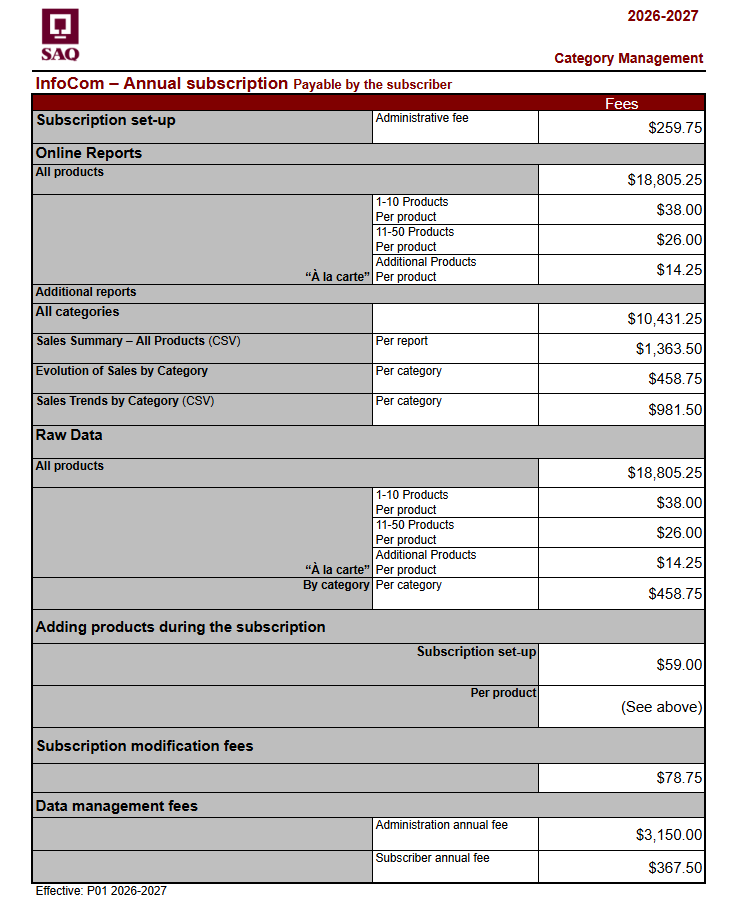
On the table presented on page 2, you can notice on the upper part of this one that there is administration fees for subscription: $259.75 for annual subscription as well as for a renewal,
and $59.00 for all modifications during the subscription.
Note : Be aware that every time you make modifications to the subscription, the $59.00 is applicable. Be sure that you have all the data on hand before
to modify the subscription, to avoid over cost.
For the basic reports of the Online reports section, you can choose between one of the two following options:
All Products: Include all active products of SAQ network
Product List: If you choose this option, you must click on the link Select Products s to identify the products for which the sales data are required.
Note: At first, the selected product list is empty. You have to click on the link Add Products.
A Search page is shown to enter the search parameters, then click on the Search button.
If the product is found, you select this one by clicking the checkbox at the left side of the product name and then click on Add to products list the bottom
of the window.
The products that have been selected are now available in your product list. Do the same steps until your product list include all the required products. When you have finished
adding products, just click on the Save button to return to the main subscription page.
Sales Summary all products (CSV file) : See this section.
Evolution of Sales by Category : For this additional report, you have the possibility to choose one of the two following options :
All Categories : : Include all active categories of SAQ network.
Category List : If you choose this option, you must click on the link Select categories to identify the categories for which the sales data are required.
At first, the selected product list is empty. You have to click on the link Add categories. A Search page is shown to enter the search parameters
(the name of the category), then click on the Search button (A single click on the search button without any parameters will show the complete list of the categories).
If the category is found, you click the checkbox at the left side of the category name and then click on Add to categories list at the bottom of the window.
Note : Attention, Do not select the categories between dashes. These are old categories and are not valid anymore.
The categories that have been selected are now available in your category list. Do the same steps until you have found all the required categories.
When you have finished adding categories, just click on the Save button to return to the main subscription page.
Raw Data Download
Similar to basic reports options…..Do the same steps of this section
After each modification, you can click on Calculate button at the bottom of the subscription page to update the total cost.
For the member users, you can specify the SAQ supplier number, or the agent number for which you want the access to SAQ Marketing information.
Supplier SAQ number |________________________|
Agent number |________________________|
Click the Continue button to go to next step.
Confirmation and acceptation
On the next page, you confirm all the selections made at the previous step.
Continue or I accept and submit my subscription
Modify before to submit : To return on previous page to make modifications
Cancel : : Cancel all the modifications or selections and close the active window.
If you submit a request of subscription while you are not already a member of one of the sites (GWS or SAQ-B2B), the following page will show a form of identification. The form
of identification allows to enter the necessary informations for the personal identification of the subscriber as well as for the identification of the company. A button I accept
and submit my subscription allows to end this step.
The acceptation button involve that :
You expressly recognize to have acquainted with Terms and Conditions governing the subscription to the Marketing Information of the Société des
alcohols du Québec and that you make a commitment to respect these conditions.
Activation
Following page is to confirm that your request of subscription was received :
Within 24 hours working, an email will be sent to you to confirm the activation of your subscription.
Note that the Société des alcohols du Québec (SAQ) will charge itself all the subscribed services.
|
Sales Information
– The sales figures exclude private orders, bulk sales and tote sales.
– The sales figures include all refunds to customers for returns of suitable and defective products.
The total sales for a product are calculated as follows:
– Quantity sold multiplied by selling price to individual, regardless of type of customer
– The selling price used is the one that is in effect at the time of the sales transaction
– Promotional prices are excluded in the calculation of sales.
Multipack sales are not recorded separately, but are included for the products that go into them.
Types of SAQ Customers
1. Permit holders : (Bars, restaurants etc.)
2. Consumers (Outlet clients)
3. Authorized distributors (sales available by authorized distributor) (Groceries etc.)
4. SAQ agencies
5. Others
Products
Product display criteria :
– Active or clearance
– Subject to category management rules
– Existent selling price
Inventories
– The amount in inventory indicates the quantity that is physically in stock
– Warehouse inventory is a consolidation of all warehouses, including specialty centers (CSM, CSQ), but not including breakage and repackaging areas
– Warehouse inventory is listed by the case
– Outlet inventory is listed by the bottle
Input and Records
– Data has been input since P07 – 2003 (August 17, 2003)
– The data is extracted weekly, and is available on Monday
– The weekly extract contains the data from Sunday to Saturday
|
Report "Evolution of Sales by category"
This report displays the total sales for each of the last 2 periords. It also displays the total of sales for the same period for the previous year along with the total for
the last 13 periods.
Available periods:
For this report, you must select a complete period at the top of the Parameters page. The current
period may be used only if the data of the fourth week is available under INFOCOM. Please also note that it is not possible to select a period previous to period 3.
Inventories (Outlets, Warehouses)
The Warehouse Inventory quantity displays the number of cases per item. The Outlet inventory information displays the number of bottles per item. Warehouse inventory
quantities may include stock currently under analysis.
Orders
The data for quantities on order is recorded once a week, generally on sundays. Any new order created during the week will only appear the following week on INFOCOM. This
applies both to the raw data file "Orders" ("Sous-commande") and to the online report "Details by product".
New products
Any new product will not appear under INFOCOM until the SAQ has completed the product introduction processes (including price calculation). Consequently it may not be
possible to find certain new products in any online report or to select some of these new products during initial subscription or during a subscription modification.
Authorized distributors
The raw data files provide details by specific authorized distributors while the online reports only provide the total of these sales under client type : authorized distributors.
Sales download of previous weeks
It is planned that Infocom will accumulate downloadable sales files for a certain number of past weeks.
Historical Data
Historic Sales information has been loaded under Infocom but this information is only available under the online reports. For exemple, the basic report "Details by product"
currently shows Sales information for almost two years back.
For more informations please contact : infoagent@saq-b2b.com
|
|